
In the next article we are going to take a look at how we can measure the response time of a website from the terminal using cURL. This is interesting to know, since it can have a great impact on the user experience.
Whether you are a web developer or you manage a server, you will know that speed it is something that should always be ready. It is important that everything works correctly so that users do not feel frustrated while accessing your site.
Next we are going to see some commands to be able to measure the response time of a website. With them we will be able check the time in seconds of different fields of both http and https pages. We will do everything from the Ubuntu command line using cURL,
Use cURL to measure loading speed
From websites with HTTP
cURL has many options available, among them we can find -w, which will be useful for print information to standard output after a completed operation. It also offers us some variables that we can use to test the different response times of a website.
To achieve this measurement, we are going to use some of the variables that can be found in the cURL official documentation. These can be passed in a given format as a literal string or within a file.
The variables that we will use will be the following:
- time_namelookup → Time in seconds. Is taken from inception until name resolution is complete.
- time_connect → Time in seconds. From startup to completion of TCP connection to remote host or proxy.
- time_pretransfer → The time in seconds it took from the beginning until the file transfer was about to begin. This includes all pre-transfer commands and negotiations that are specific to the protocols involved.
- time_starttransfer → The time in seconds it took from the beginning until the first byte was about to be transferred. This includes time_pretransfer and also the time it took for the server to calculate the result.
- time_total → Total time in seconds that the entire operation lasted. It is resolved in milliseconds.
For execute the command that we are going to mount with the previous variables, we will only have to open a terminal (Ctrl + Alt + T) and write:
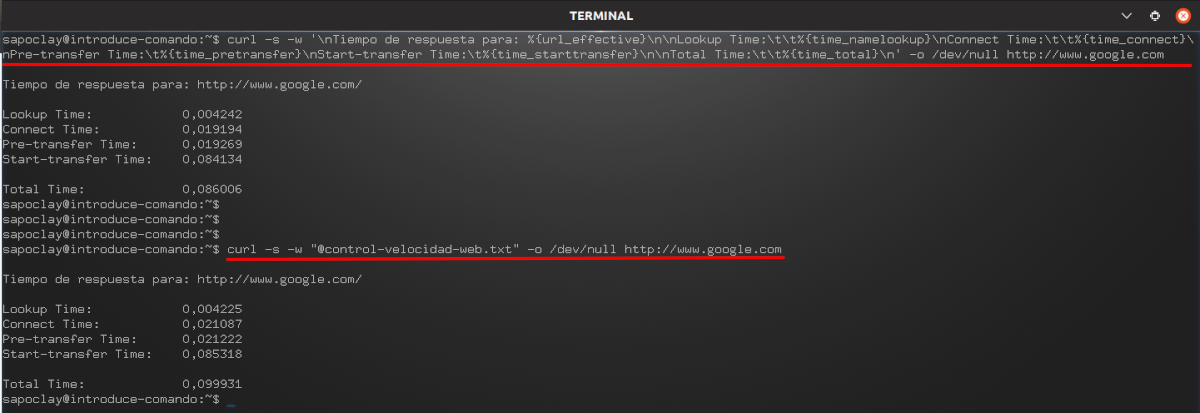
curl -s -w '\nTiempo de respuesta para: %{url_effective}\n\nLookup Time:\t\t%{time_namelookup}\nConnect Time:\t\t%{time_connect}\nPre-transfer Time:\t%{time_pretransfer}\nStart-transfer Time:\t%{time_starttransfer}\n\nTotal Time:\t\t%{time_total}\n' -o /dev/null http://www.google.com
As this can become a bit cumbersome to write it in a terminal every time we want to use it, we can choose to write it to a file.
Inside the file, to which I am going to give the name of control-speed-web.txt, you have to paste the following code:
\nTiempo de respuesta para: %{url_effective}\n\nLookup Time:\t\t%{time_namelookup}\nConnect Time:\t\t%{time_connect}\nPre-transfer Time:\t%{time_pretransfer}\nStart-transfer Time:\t%{time_starttransfer}\n\nTotal Time:\t\t%{time_total}\n
Once saved and back in the terminal, we can use this file by typing the following syntax:
curl -s -w "@control-velocidad-web.txt" -o /dev/null http://www.google.com
The above command will work on silent mode thanks to -s. With -w the information is printed in stdout. For redirect the output to / dev / null let's use -o.
From websites with HTTPS
If we are interested in using this test for HTTPS sites, we can execute the command in the terminal (Ctrl + Alt + T):
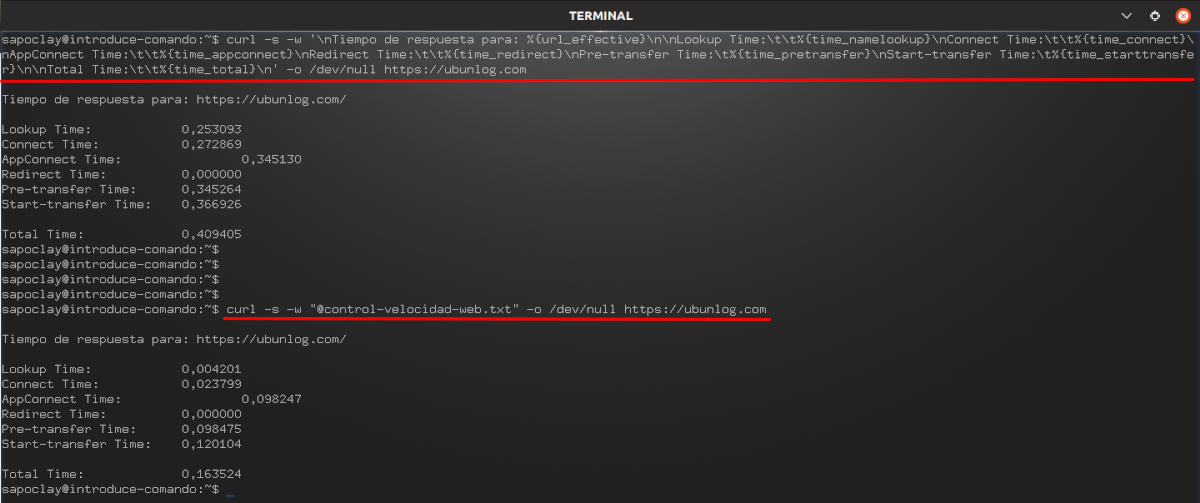
curl -s -w '\nTiempo de respuesta para: %{url_effective}\n\nLookup Time:\t\t%{time_namelookup}\nConnect Time:\t\t%{time_connect}\nAppConnect Time:\t\t%{time_appconnect}\nRedirect Time:\t\t%{time_redirect}\nPre-transfer Time:\t%{time_pretransfer}\nStart-transfer Time:\t%{time_starttransfer}\n\nTotal Time:\t\t%{time_total}\n' -o /dev/null https://ubunlog.com
In this format more time variables are used in addition to the above. And these are:
- time_appconnect → The time in seconds it took from the beginning until the SSL / SSH / etc connection to the remote host was completed.
- time_redirect → Time in seconds, which took all redirection steps before the final transaction started. Calculate the total execution time for multiple redirects.
As in the previous case, it can also be written to a file. As in the previous case I will call control-speed-web.txt, and inside you will have to paste:
\nTiempo de respuesta para: %{url_effective}\n\nLookup Time:\t\t%{time_namelookup}\nConnect Time:\t\t%{time_connect}\nAppConnect Time:\t\t%{time_appconnect}\nRedirect Time:\t\t%{time_redirect}\nPre-transfer Time:\t%{time_pretransfer}\nStart-transfer Time:\t%{time_starttransfer}\n\nTotal Time:\t\t%{time_total}\n
Saved the file and back in the terminal, we can use it with syntax:
curl -s -w "@control-velocidad-web.txt" -o /dev/null https://ubunlog.com
For more information, you can consult the cUrl documentation or the man page:
man curl
How to Live Aligned with response time values will change due to different factors, it is advisable to carry out different tests and establish an average speed. Something that we are also going to see is that accessing a website through HTTP is generally much faster than doing it through HTTPS.