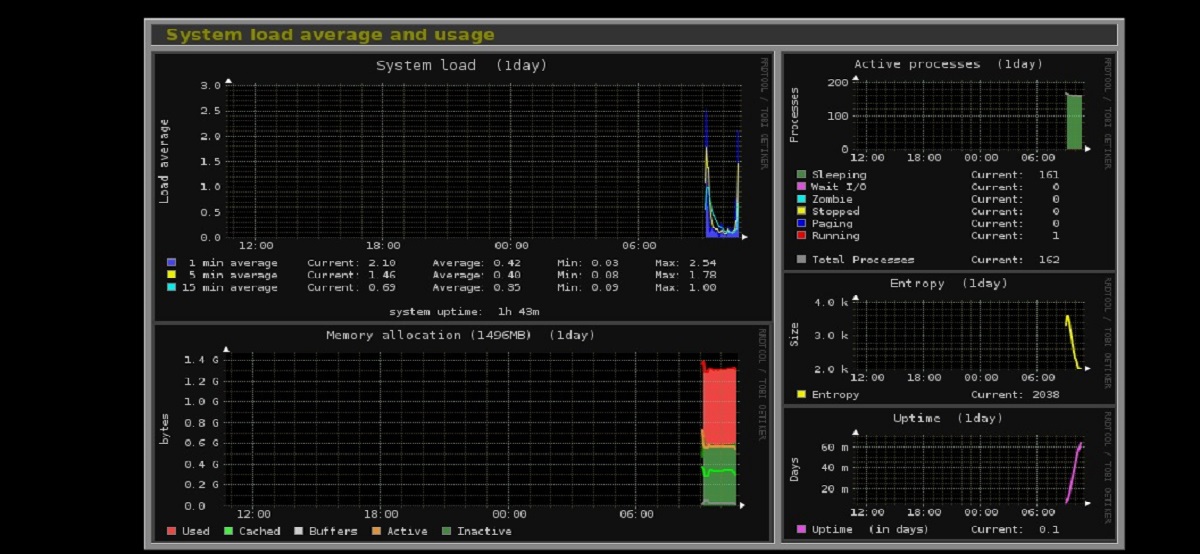
A few days ago, the release of the new version of Monitorix 3.14.0, which is designed to visually monitor the operation of various services, for example, monitor CPU temperature, system load, network activity, and responsiveness of network services.
Monitorix has been created to be used on production Linux / UNIX servers, but due to its simplicity and small size it can also be used on embedded devices. This application consists mainly of two programs: a collector, called monitorix, which is a Perl daemon that starts automatically like any other service on the system, and A CGI script called monitorix.cgi.
The system is written in Perl, RRDTool It is used to generate graphics and store data, the code is distributed under the GPLv2 license.
Main novelties of Monitorix 3.14.0
In this new version that is presented added nvme.pm module to monitor NVMe storage devices (NVMExpress). Among the parameters taken into account: disk temperature, load, logged errors, intensity of write operations,
In addition to that too it is noted that the amdgpu.pm module was added to track the status of an arbitrary number of AMD GPUs. The dynamics of changes in parameters such as temperature, power consumption, cooler speed, video memory consumption, and GPU frequency changes are monitored.
Another important change is that added nvidiagpu.pm module for advanced monitoring of NVIDIA GPU-based video cards (a more advanced version of the previously available nvidia.pm module).
On the other hand, we can also find that process.pm support has been added for systems with different maximum PID values defined in /proc/sys/kernel/pid_max, as well as a new graph of the process activity time in process format. pm which comes with a new option called time_unit to set the chart scale. [
Support for IPv6 has also been added to the traffic monitoring module traffacct.pm, as well as the interface mode of operation implemented in the form of a full-screen web application.
Of others changes that stand out:
- Added time_unit option to system.pm to set the scale of the uptime graph.
- Added new -s command line option to decide which part of a line in the config file will be the key and which will be the value.
- Added a home button in the upper left corner to easily go to the main page
- Added the ability to view the website as a web application in full screen mode.
- Changed the way the cmd option in port.pm works, directly executing the defined command (no arguments), unless it's not defined, in which case it will still default to ss.
- Added some changes to monitorix-alert.sh to be able to link to it and act as a generic alert script.
- Added fan speed (as fan), power (as pwr), percentage (as pct), and byte (as byt) identifiers to gensens.pm.
Finally, if you are interested in being able to know more about it, you can consult the details in the following link
How to install Monitorix on Ubuntu and derivatives?
For those who are interested in being able to install this tool on their system, They can do so by following the instructions we share below.
We will download and install the required dependencies for the operation of Monitorix in our system.
sudo apt-get install rrdtool perl libwww-perl libmailtools-perl libmime-lite-perl librrds-perl libdbi-perl libxml-simple-perl libhttp-server-simple-perl libconfig-general-perl
As next step let's download the latest stable version of Monitorix:
wget https://www.monitorix.org/monitorix_3.14.0-izzy1_all.deb -O monitorix.deb
Already done the download, now we proceed to install the application in the system with the help of the following command:
sudo dpkg -i monitorix.deb
And we solve any problem with dependencies by executing the following command:
sudo apt-get install -f
The application is already installed now we are going to start the service in the system, we do this by executing:
sudo service monitorix start
How to access monitorix?
To access the service remotely or locally We can do it from a web browser directing to the ip address of our server, being as follows:
http://ipservidor:8080/monitorix
The program's configuration file is in the following path /etc/monitorix.conf. Here you can change the port, deny or allow the remote host, and make other settings.
Before changing the parameters, make a backup copy of this file:
cp -pRvf /etc/monitorix/monitorix.conf /etc/monitorix/monitorix.conf.back
In this file we can also use it to ensure web access with authentication, with which we only have to configure:
set enabled=y
Which is under the section and then create a file in / var / lib / monitorix / htpasswd and where username is replaced by the username for access.
The command to do it is:
touch /var/lib/monitorix/htpasswd

htpasswd -d /var/lib/monitorix/htpasswd && username