
In the next article we will take a look at a utility collection called "netutils-linux". These can be used to simplify troubleshooting and network performance tuning on our Gnu / Linux systems.
These profits can be useful for data centers and internet service providers with a heavy workload in the RED. We will probably not see its full effectiveness on our desktop computer, although you can always take advantage of it. It is now in production use and can save us a lot of time with debugging hardware and software setup.
Netutils-linux tools
This set of utilities will help automate the Gnu / Linux performance tuning process out of the box. Netutils-linux is made up of the following tools:
- network-top
- snmptop
- irqtop
- softirq-top
- link rate
- softnet-stat-top
- rss-ladder
- authors
- maximize-cpu-freq
- rx-buffers-increase
- server info
Install Netutils-linux
Netutils-linux is developed using the Python programming language. Therefore and thanks to this, you can install easily using PIP. First of all in Debian, Ubuntu and also in Linux Mint we can install pip by opening a terminal (Ctrl + Alt + T). In it we are going to write the following command:
sudo apt-get install python-pip
After installing PIP, we will only have to execute the following command to install netutils-linux:
sudo pip install netutils-linux
Using Netutils-linux
As I have mentioned lines above, Netutils-linux contains a lot of utilities specially designed for troubleshooting network problems and also for network performance tuning. All utilities are classified into three sections:
- Construction inspection
- Tuning
- Hardware and its configuration classification
Construction inspection
All these top-level tools that we can find under the supervision section do not require root privileges. We will be able to use them as a normal user without any problem.
network-top

This utility will allow us monitor interrupts, network processing statistics for devices and also CPUs. To run this utility, we will simply have to run in the terminal (Ctrl + Alt + T):
network-top
snmptop
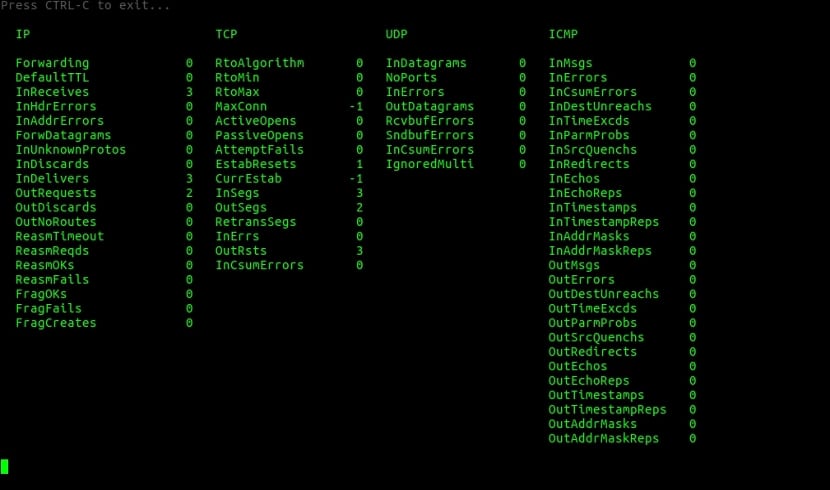
It's a basic packet watcher de / proc / net / smmp. To execute this utility, we will only have to execute the following command:
snmptop
irqtop

This utility will show us in a simple way a interrupt rate based on / proc / interrupts file of our Gnu / Linux system. Do not forget that we will be able to execute this utility simply by using the command:
irqtop
softirq-top

This command will show us the packet transmission and reception rate based on / proc / softirqs file. To make use of this command, we will only have to execute in the terminal (Ctrl + Alt + T):
softirq-top
link rate
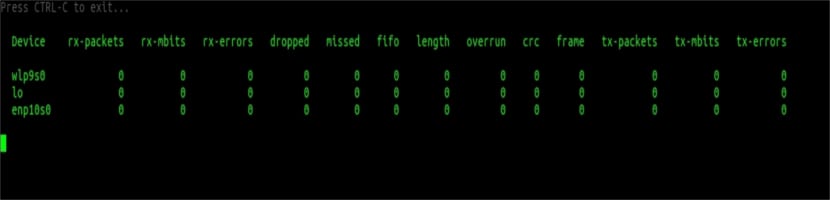
When executing this tool, it will show us how many packets / bytes a network interface receives / transmits and how many errors occur based on the / sys / class / net / XXX / statistic / YYY files. To use this command, we will simply write in the terminal (Ctrl + Alt + T):
link-rate
softnet-stat-top
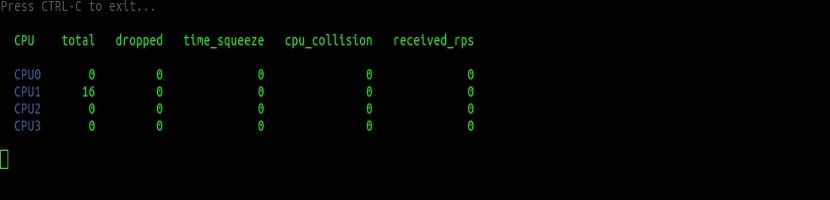
Show various statistics on the processing of packets by the CPU on our Gnu / Linux system. We will simply have to type in the terminal (Ctrl + Alt + T) the following to obtain the results:
softnet-stat-top
Tuning
To run these tools we will have to use them as root or with sudo.
rss-ladder
Automatically sets smp_affinity_list for IRQ NIC rx / tx queues that normally work on CPU0. It also supports double / quad scaling for multiprocessor systems.
sudo rss-ladder enp10s0 0
authors
Allows RPS on all available CPUs of the local NUMA node for all NIC rx queues. It should also be clarified that it is a good tool for cheap network cards.
sudo autorps enp10s0
maximize-cpu-freq
This utility sets a CPU performance scale. You are also going to set the maximum scale value for the minimum scale value. This means that we will be able to use all the power of our processors. Another point to keep in mind is that it will also be very useful for latency-sensitive systems.
sudo maximize-cpu-freq
rx-buffers-increase
This utility finds and sets the required value avoid lost or missing packets while maintaining low latency.
Hardware and its configuration classification
server info
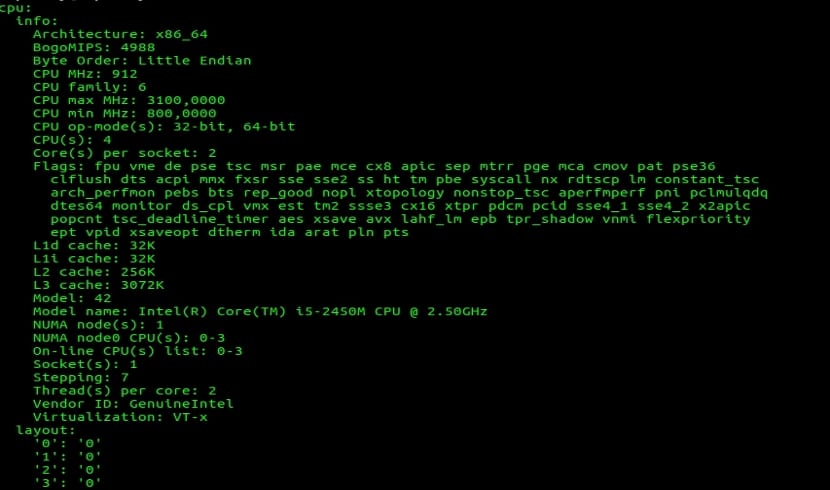
This utility is similar to lshw command. We can make use of it by typing in the terminal (Ctrl + Alt + T):
sudo server-info show

The server-info utility as well can classify hardware in addition to all its characteristics on the scale from 1 to 10. In addition to accessing this classification, we can do it simply by typing in the terminal (Ctrl + Alt + T):
sudo server-info rate
Anyone who wants to can learn more about this toolkit on the page GitHub of the project. There you will find a more detailed description of them.
Uninstall netutils-linux
To eliminate this group of applications from our system, we will simply have to open a terminal (Ctrl + Alt + T) and write in it:
sudo pip uninstall netutils-linux