
In the next article we are going to take a look at Collectl. This is a lightweight tool for monitor system performance, which can be used to collect performance data that describes the current state of the system.
Compared to other tools for the same purpose, this one collects information about many different types of system resources such as; la CPU, disk, memory, network, sockets, tcp, inodes, memory, nfs, processes, etc. It can be run interactively or as a 'daemon', and has the ability to record and replay the captured data. It will also allow us to export the data to various file formats.
General characteristics of Collectl
Among others, this tool offers users the following features:
- Collectl does not focus on a limited number of system metricsInstead, it can collect information about many different types of system resources such as; cpu, disk, memory, network, sockets, tcp, inodes, infiniband, gloss, nfs, processes, quadrics, slabs and buddyinfo.
- This tool uses very little CPU. In fact, it has been measured to use 0.1% when run as a 'daemon' using the default sample interval of 60 seconds for process data and 10 seconds for everything else.
- Can be run interactively, as a daemon, or as both.
- Has the ability to monitor almost any subsystem.
- Can play the role of many other utilities designed for a single purpose, as they are; ps, top, iotop or vmstat.
- This tool also offers the ability to record and replay captured data.
- Can export the data in various file formats.
- The tool can run as a service to monitor remote machines or an entire server cluster.
- We too it will display data in terminal, write to file or socket.
These are just some of the features of this program. They can consult all of them in detail from the project website.
Install Collectl
By default, the package Collectl is available in Ubuntu's default repository. Installing it on our system will be as simple as opening a terminal (Ctrl + Alt + T) and executing the command:
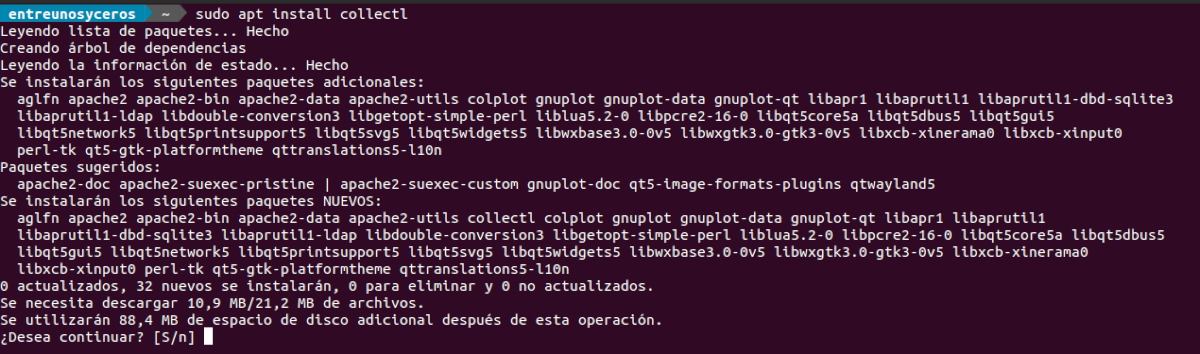
sudo apt install collectl
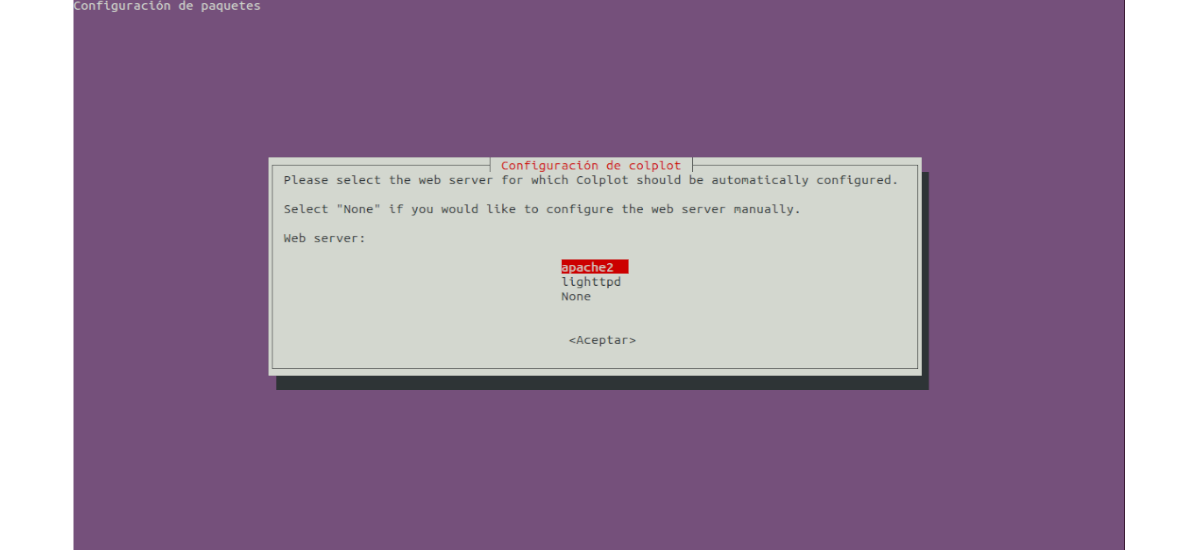
During the installation, it will ask us to select the web server for which Colplot It must be self-configured, although we will have the possibility to select the 'None ' for manual setup later.
Use
Once the installation of this tool is finished, we will be able to easily run it from terminal, even without any option. The following command will display information about CPU, disk, and network statistics in a short, human-readable format.
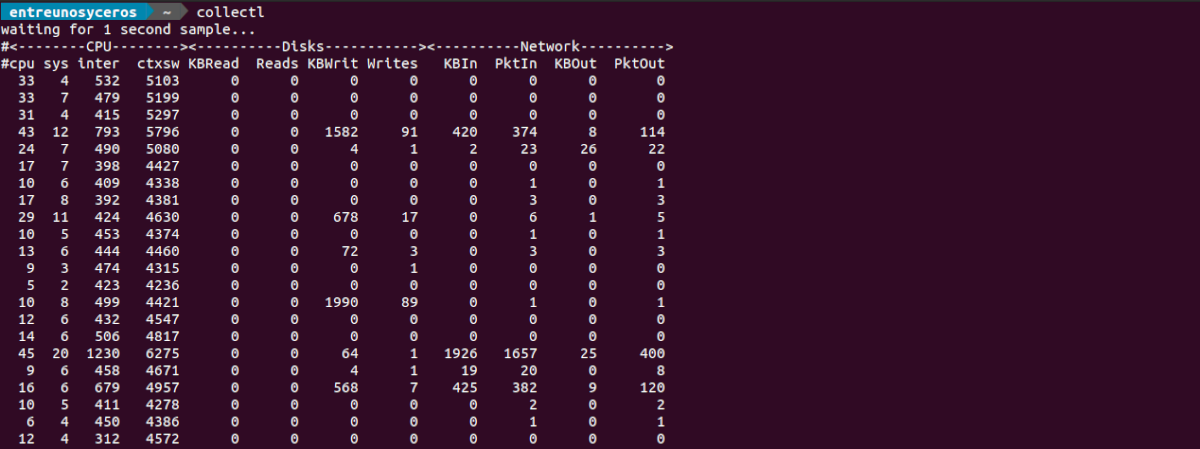
collectl
If you are interested print statistics for all subsystems, the command that we will have to execute must include the –all option:
collectl --all
If we want use Collectl with top, we will have to execute the following command with the –top option:
collectl --top
If you're looking for monitor all resources together, the command to execute would be the following:
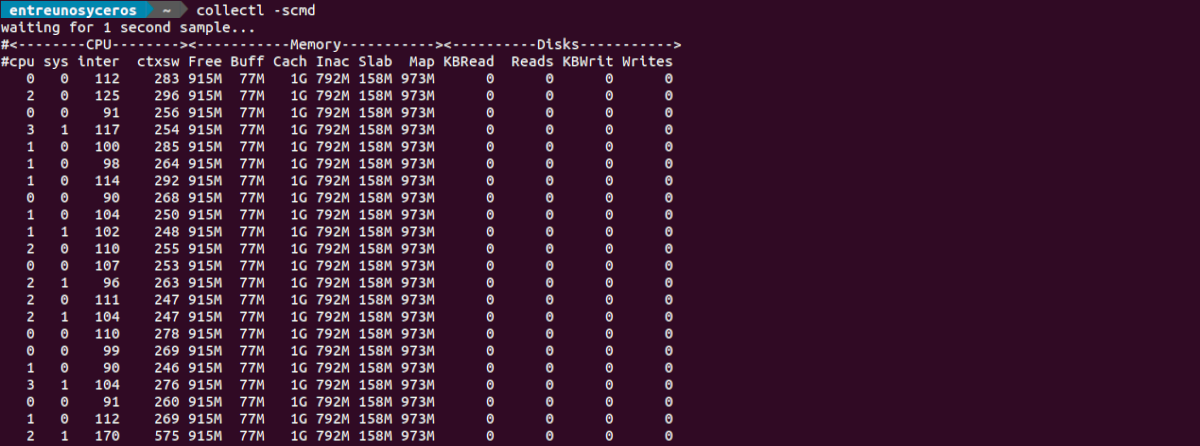
collectl -scmd
Whenever we want see the memory usage of our system, we will only need to execute the command with the -sm option:
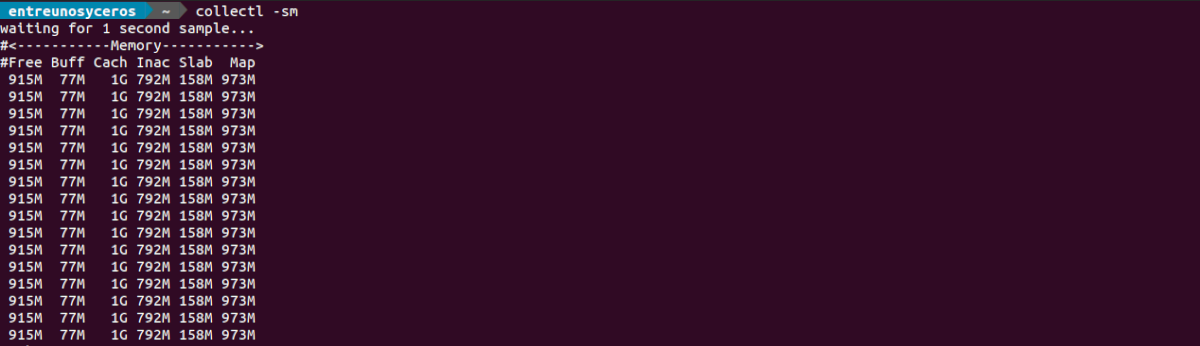
collectl -sm
This tool can also display information about CPU, disks, and network data with the following command:
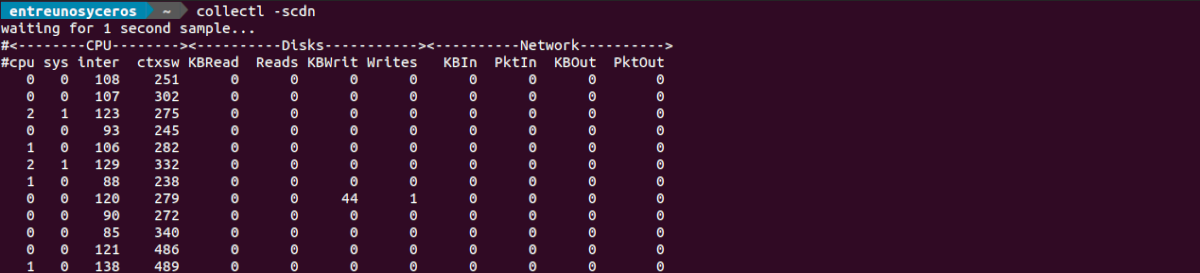
collectl -scdn
For get information about CPU and TCP, the command that we should execute would be the following:
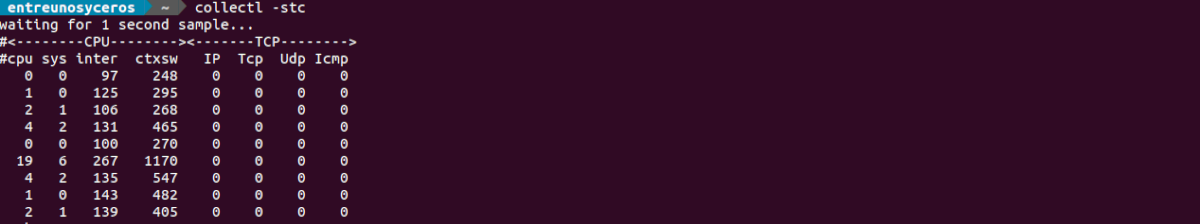
collectl -stc
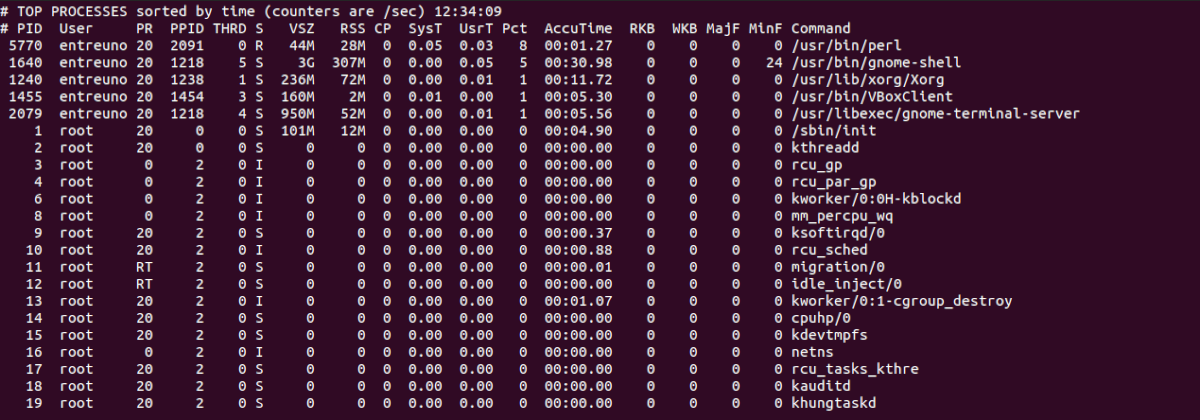
For obtain information about the processes in our system, we can run the collectl command with the following options:
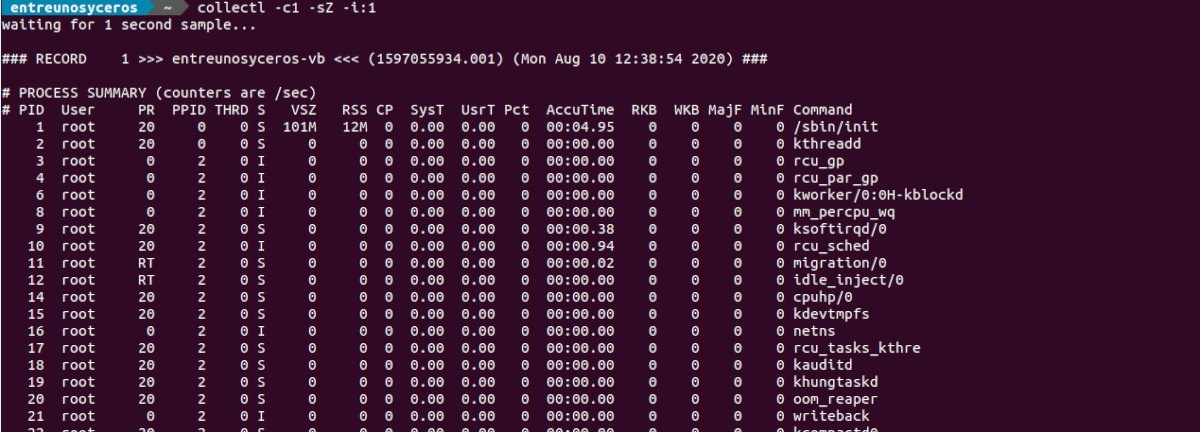
collectl -c1 -sZ -i:1
These are just some of the possibilities that this utility offers us. If you want consult the help of this and see all the available options, in the terminal (Ctrl + Alt + T) you just have to type the command:
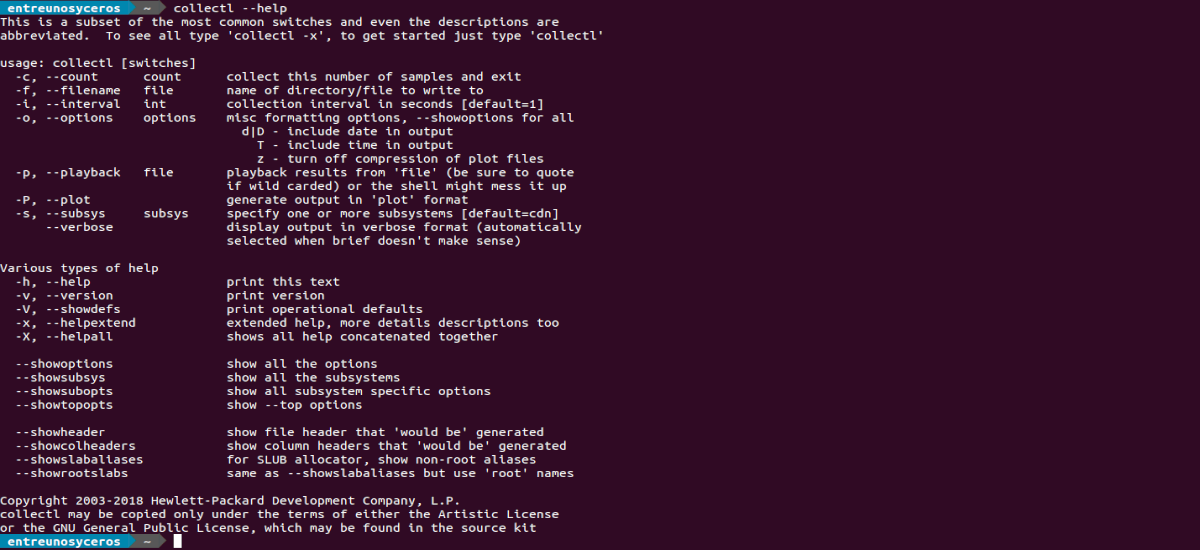
collectl --help
We can also choose read man pages typing in terminal (Ctrl + Alt + T):
man collectl
In these lines we have seen a basic use of the Collectl command line utility to monitor system performance. For more information about how it works, users can consult the project documentation or examples that they offer on their website.