After 6 months of development, a new version of the Zabbix 4.4 monitoring system is available, whose code is distributed under the GPLv2 license. For those who still do not know about Zabbix, they should know that this is a network monitoring system, which is designed to monitor and record the status of various network services, servers, and network hardware. Use MySQL, PostgreSQL, SQLite, Oracle, or IBM DB2 as your database. Its backend is written in C and the web frontend is written in PHP.
Zabbix consists of three basic components: un server to coordinate checks, generate test requests, and collect statistics; agents to perform checks on the side of external hosts; interface to organize the management of the system. To ease the load on the core server and form a distributed monitoring network, a number of proxy servers can be deployed that aggregate data on host group verification.
Without agents, the Zabbix server can receive data using protocols such as SNMP, IPMI, JMX, SSH / Telnet, ODBC and test the availability of web applications and virtualization systems.
Main news in Zabbix 4.4
In this new version of Zabbix 4.4 they have been prepared specifications for designing templates to standardize configurations. The structure of the XML / JSON files is reduced to a form suitable for editing the template manually in a normal text editor. The existing templates are aligned with the proposed specifications.
It has been implemented a knowledge base for documenting proven triggers and elements, which can be provided with a detailed description, an explanation of the objectives of collecting information and instructions for action in case of problems.
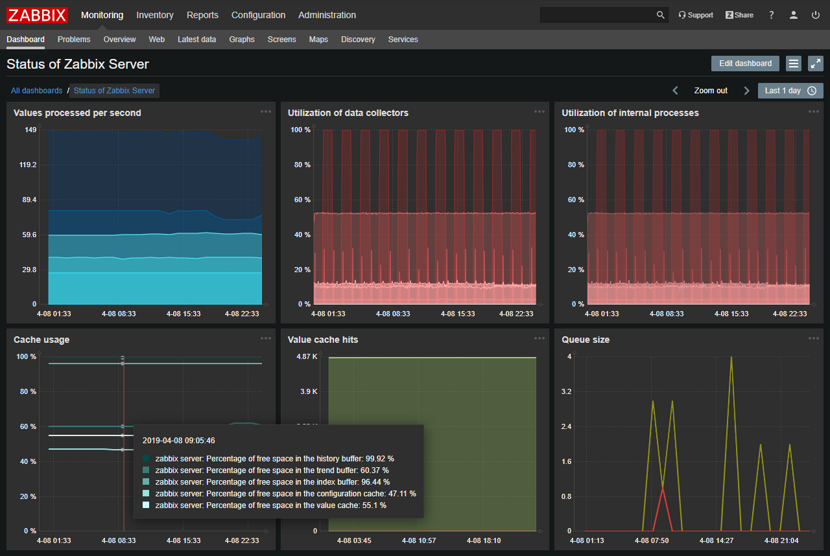
Are presented advanced features to view the status of the infrastructure. Added the ability to change widget settings with one click. The graphics sets are optimized for viewing on widescreen displays and large wall panels.
All widgets are adapted for viewing in untitled mode. A new widget has been added to display chart prototypes. A new view mode has been added to the widget with summary problem statistics.
Another novelty is that a new type of agent is introduced: zabbix_agent2, written in the Go language and which provides a framework for developing plugins to verify various services and applications.
The new agent includes a built-in scheduler with support to set a flexible schedule to perform verifications and can track the status between verifications (for example, keep the connection to the DBMS open). To save traffic, sending received data in batch mode is supported.
The new agent can be used to transparently replace the old one so far only on the Linux platform.
Added the ability to use web links and custom actions and notification controllers when detecting failures of the controlled services. Controllers can be created in JavaScript and used to access external notification delivery services or bug tracking systems. For example, you can write a handler to send troublesome messages to corporate chat.
How to install Zabbix 4.4 on Ubuntu and derivatives?
Si do you want to install this utility in your system, you can do it by opening a terminal (you can use the key combination Ctrl + Alt + T) and in it you will type the following:
wget https://repo.zabbix.com/zabbix/4.4/ubuntu/pool/main/z/zabbix-release/zabbix-release_4.4-1+bionic_all.deb

sudo dpkg -i zabbix-release_4.4-1+bionic_all.deb

sudo apt update

sudo apt -y install zabbix-server-mysql zabbix-frontend-php zabbix-apache-conf zabbix-agent
As mentioned at the beginning, Zabbix uses a database to store information, so you must have some of the supported ones already installed on your system, in addition to using Apache, so I recommend installing Lamp. Done the installation now we must create a database for Zabbix, we can do this by typing:
sudo mysql -uroot -p

password

mysql> create database zabbix character set utf8 collate utf8_bin;

mysql> grant all privileges on zabbix.* to zabbix@localhost identified by 'contraseña';

mysql> quit
Where 'password' is the password of your database that you must remember or write down to later place it in a configuration file.
Now we are going to import the following:
zcat /usr/share/doc/zabbix-server-mysql*/create.sql.gz | mysql -uzabbix -p zabbix
Y let's edit the following file, where we are going to place the database password:
sudo nano /etc/zabbix/zabbix_server.conf
And we are going to look for the line "DBPassword =" where we are going to put the password of the database.
Now we are going to edit the /etc/zabbix/apache.conf file:
And we look for the line "php_value date.timezone" which we are going to uncomment (removing the #) and we are going to place our time zone (in my case Mexico):
php_value date.timezone America/Mexico
Finally we restart the service with:
sudo systemctl restart zabbix-server zabbix-agent apache2

sudo systemctl enable zabbix-server zabbix-agent apache2
To access Zabbix, you can do it from your web browser by going to the path (in the case of a server) http: // server_ip_or_name / zabbix or on a local computer localhost / zabbix
If you want to know more about the use of Zabbix you can consult the following link.