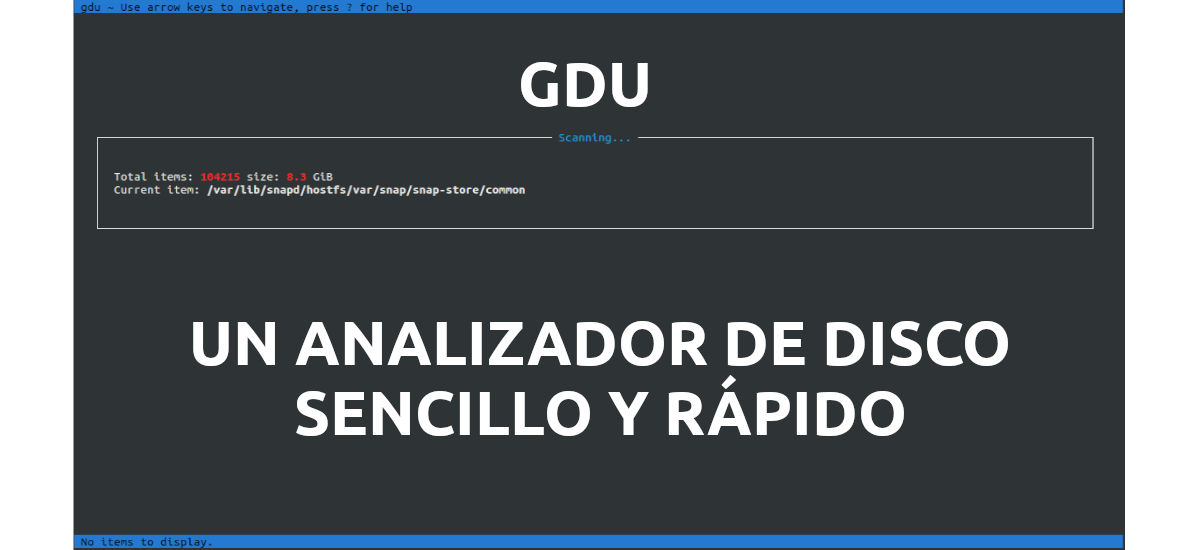
In the next article we are going to take a look at gdu. Is about a disk usage analyzer, which is open source and written in go. Gdu can be found available for Gnu / Linux, macOS, and Microsoft Windows. According to its creator, this program is inspired by godu, dua, ncdu and df.
Gdu (Go Disk Usage) is very similar to ncdu, a popular disk usage analyzer console. Although it has an important difference, and it is the speed of the program. The gdu tool is created for SSD drives, where parallel processing can be used. This tool can also work with HDD, but it gets lower performance compared to SSD drives.
Gdu, a disk usage analyzer that we can use in Ubuntu
Ubuntu users can use different ways to install gdu, such as:
Install from repository
To use this installation option, let's start by adding the project repository. We can do this by opening a terminal (Ctrl + Alt + T) and executing the command in it:

sudo add-apt-repository ppa:daniel-milde/gdu
After updating the software available from the repositories, we can now proceed to installation with this other command:
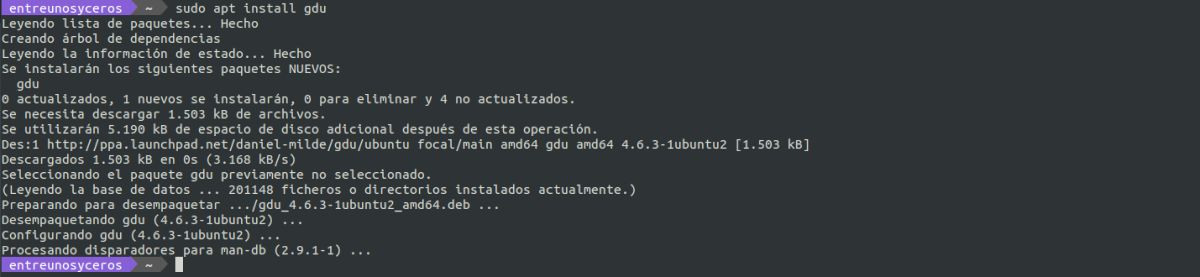
sudo apt install gdu
Install as snap
We will also find this program available at Snapcraft. For install it on our computer we just need to open a terminal (Ctrl + Alt + T) and run the command:

snap install gdu-disk-usage-analyzer
After installation we will need establish the necessary connections:

snap connect gdu-disk-usage-analyzer:mount-observe :mount-observe
snap connect gdu-disk-usage-analyzer:system-backup :system-backup
And to finish we will create an alias, so that we can start the program by just typing gdu. This can be done using the command:

sudo snap alias gdu-disk-usage-analyzer.gdu gdu
Install from GitHub
To install the latest version of this program, we can go to the releases page from gdu on GitHub to download the required file. The latest version published here is 4.9.1. If you want to use the terminal for the download, you can use curl in a terminal (Ctrl + Alt + T) as follows:

curl -L https://github.com/dundee/gdu/releases/latest/download/gdu_linux_amd64.tgz | tar xz
After the installation, we will give execute permissions to the downloaded file. We will do this with the command:
chmod +x gdu_linux_amd64
In conclusion, let's move the file to the directory / usr / bin, and so we can use it from any folder on our system operational:

sudo mv gdu_linux_amd64 /usr/bin/gdu
Verify the installation
Whatever option you use to install the program, now we can check installation and version executing the following command:

gdu --version
I have to say that in the previous screenshot, the installed version is the one obtained today by downloading the program from GitHub.
A quick look at gdu
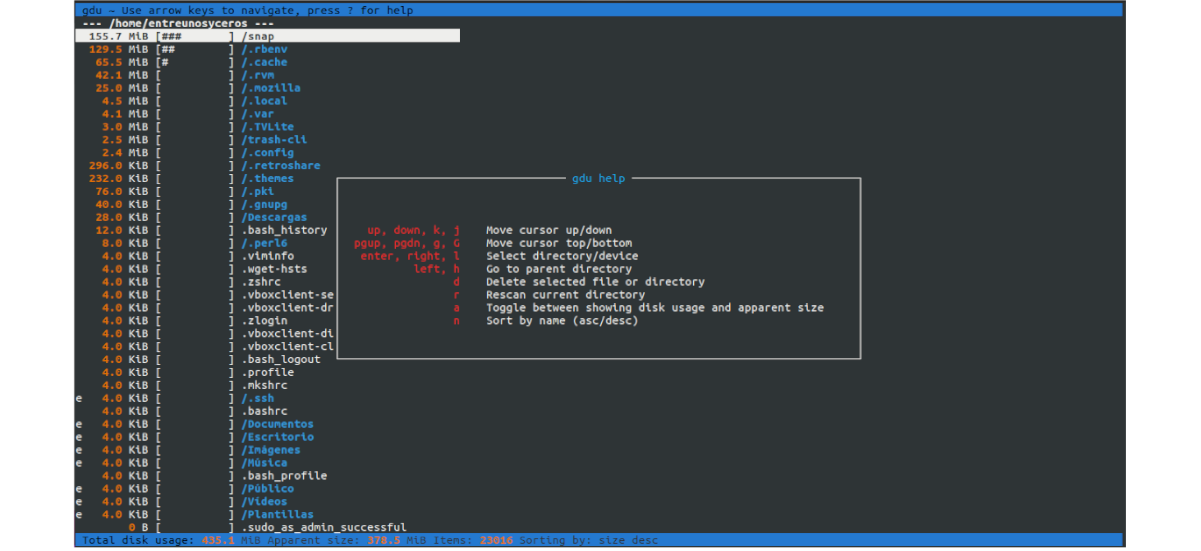
As it has a terminal user interface (TUI), we will be able to navigate through directories and disks using keyboard arrows. It will also allow us to sort the result by file name or size.
- Up arrow ok → move the cursor up.
- Down arrow oj → to move the cursor down.
- Intro → select directory / device.
- Left arrow oh → go to the main directory.
- d → delete the selected file or directory. It will ask for confirmation.
- n → sort by name.
- s → sort by size.
- Ctrl + c → exit the application.
To know more about the operations that we can perform with this tool, just do you have to press? from the program interface to access help.
Running gdu
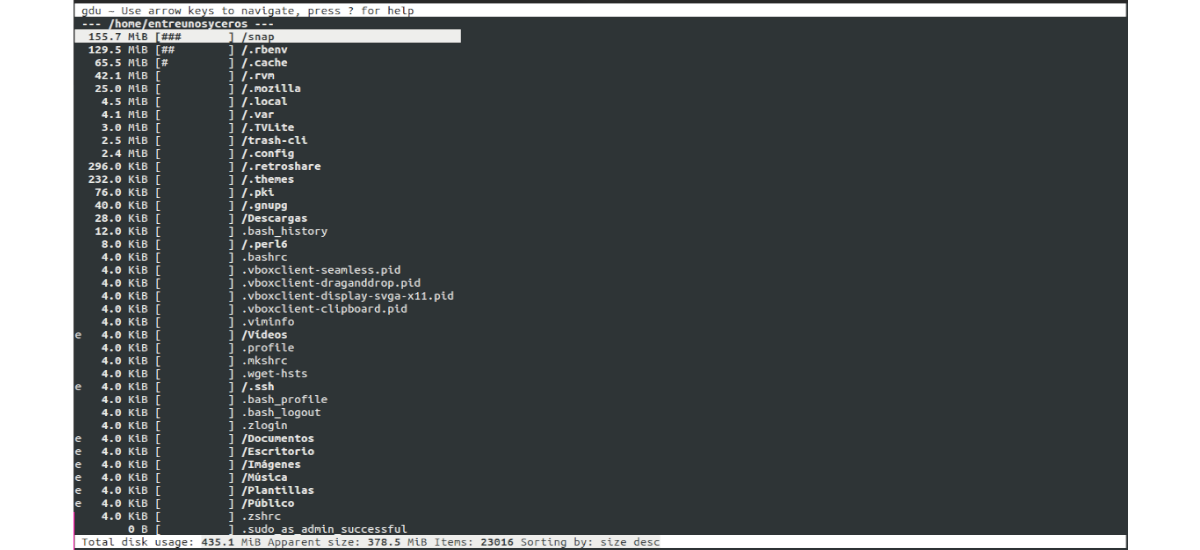
If we run the gdu command without passing any arguments, it will scan the current working directory:
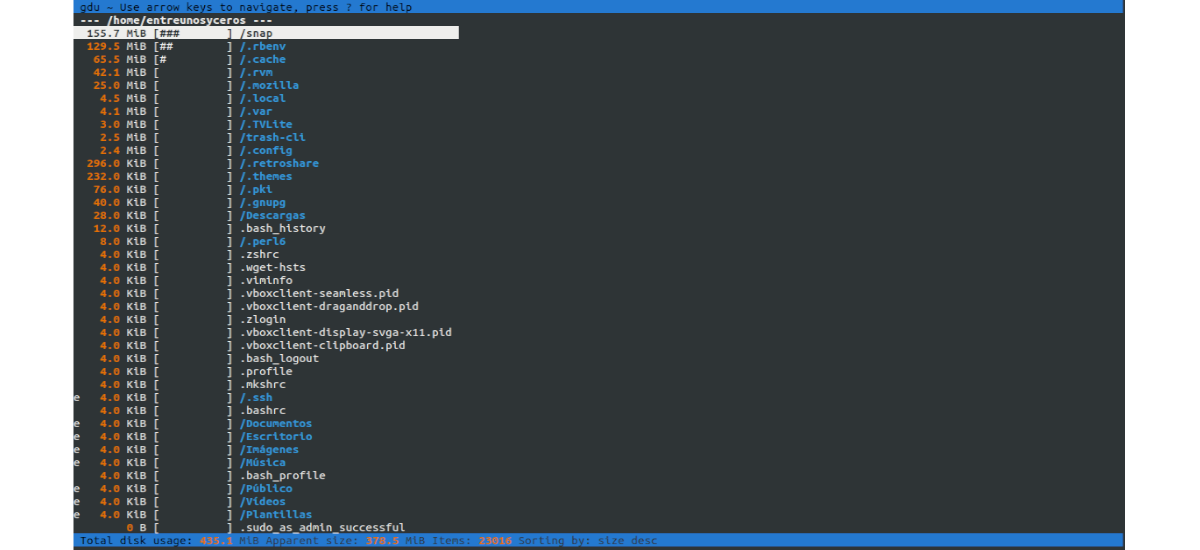
gdu
For scan particular directories, we must pass the directory name as an argument:
gdu /ruta/de/carpeta/
It is possible during or after the scan we see special characters in files and directories, and each one has a special meaning. The characters that we can find are the following:
- [! ] → Error reading directory
- [. ] → Error reading subdirectory.
- [@] → The file is socket or simlink.
- [H] → Hardlink that is already counted.
- [e] → Empty directory.
If you prefer see the black and white output, we can use the option '-c' when we run the program:
gdu -c /ruta/de/carperta/
All the commands so far will launch an interactive mode to display disk statistics. If what interests us is that the output is in non-interactive mode, we will only have to add the option '-n' in command.
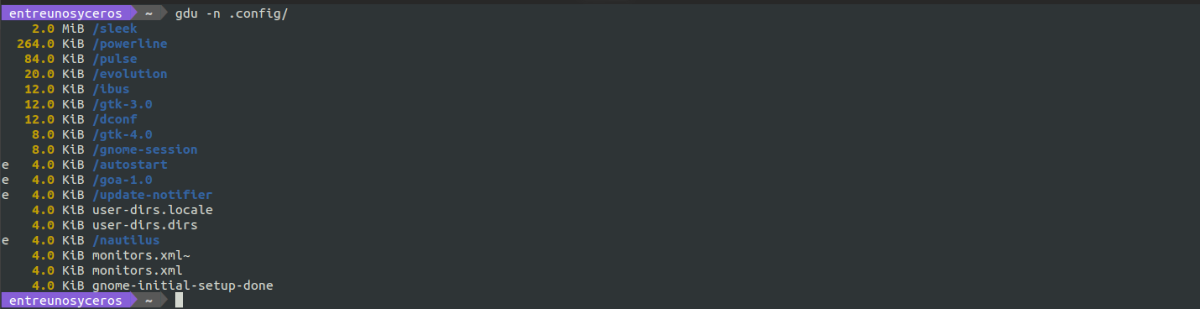
gdu -n .config/
Help
These are just some of the options that we can use when we launch this program. They can check all available possibilities typing in terminal (Ctrl + Alt + T):
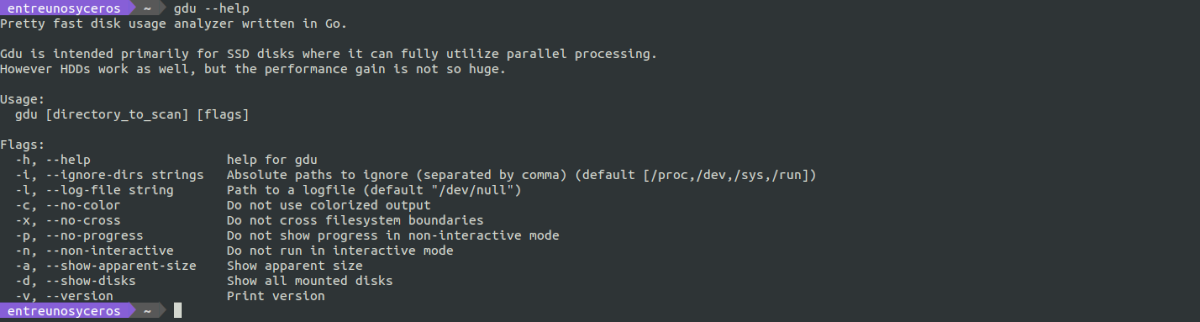
gdu --help
There are many other similar tools with the same goal. This is one more option, which can be adapted to the needs of some users. It can learn more about this tool from the page on GitHub of the project.