
In the next article we are going to take a look at Grafana. This is a analysis and monitoring software. It's open source, feature-rich, powerful, elegant, and highly extensible. We can run it on Gnu / Linux, Windows and MacOS. Is a software for data analysis, which is used in some well-known sites such as Stack Overflow, PayPal or Uber.
Supports over 30 open source sources as well as commercial databases / data sources including MySQL, PostgreSQL, Graphite, Elasticsearch, OpenTSDB, Prometheus, and InfluxDB. With the we will be able to delve into large volumes of operational data in real time. We will be able to view, consult, set alerts and obtain information on your metrics.
It is important to note that Grafana allows the creation of multiple independent organizations. Each one with its own environment of use (administrators, data sources, panels and users).
General characteristics of Grafana

- We will have elegant graphics for data visualization. Graphics are fast and flexible, with numerous options.
- Puts at our disposal dynamic and reusable panels.
- Es highly extensible, we can use many panels and plugins available in the official library.
- Will put at our disposal the authentication via LDAP, Google Auth, Grafana.com, and Github.
- Strongly supports collaboration by enabling data exchange and dashboards between teams.
- A is available online demo so you can try Grafana before installing it on your computer.
Install Grafana on Ubuntu 18.04
We will install Grafana from your official repositories. So we can update it using our default package manager. First of all, say that we will have to have curl installed in our system. Next we open the terminal (Ctrl + Alt + T) and we are going to write each of the following lines:
echo "deb https://packagecloud.io/grafana/stable/debian/ stretch main" | sudo tee -a /etc/apt/sources.list

curl https://packagecloud.io/gpg.key | sudo apt-key add -

sudo apt-get update

sudo apt-get install grafana
Location of important files
After finishing the installation in our Ubuntu, we will be able to find the important files in the following locations:
- El binary file we will find it in / usr / sbin / grafana-server.
- El script init.d will be found in /etc/init.d/grafana-server.
- Create the default file (vars environment) in / etc / default / grafana-server.
- Install the configuration file en /etc/grafana/grafana.ini.
- The default setting sets the log file en /var/log/grafana/grafana.log.
- The default settings specify a sqlite3 db en /var/lib/grafana/grafana.db.
- The HTML / JS / CSS file and other Grafana files en / usr / share / grafana.
Start Grafana
Next, we will start the service. We will first check if this is working and then we will enable it to start automatically at boot time. By default, the process runs as the grafana user (created during the installation process) Y listen on HTTP port 3000.
Next we will see two ways to start the server:
Start via Systemd
We start by typing in the terminal (Ctrl + Alt + T):
systemctl daemon-reload
We continue starting the service by typing in the same terminal:
systemctl start grafana-server

systemctl status grafana-server
If someone needs it, you can know more about how to start the service in this way on the project website.
Start via init.d
service grafana-server start

service grafana-server status

sudo update-rc.d grafana-server defaults
You can get more information about how to start the service in this way on the project website.
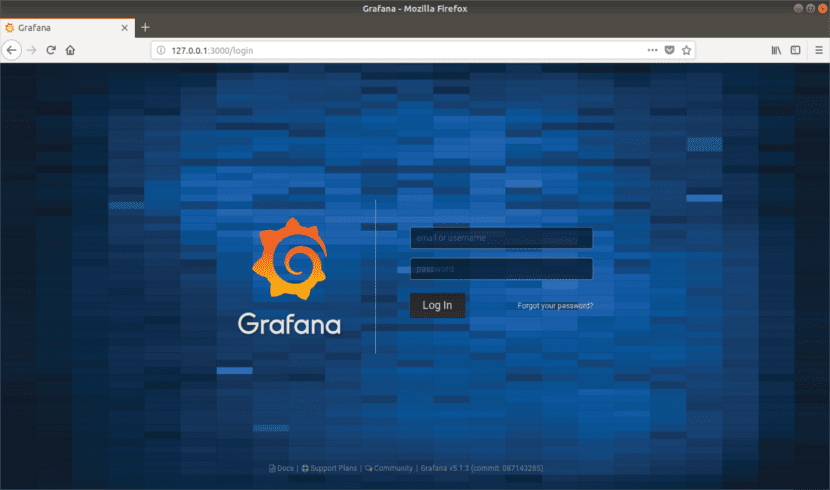
Login page
Once the server is started, we can open our favorite browser and write the following URL: http://direccion-IP:3000 o http://tu-dominio.com:3000 for access the web interface. This address will take us to the login page. Here we can use the user credentials like username: admin y password: admin.
After logging in, we will access the home panel, as shown in the screenshot below.
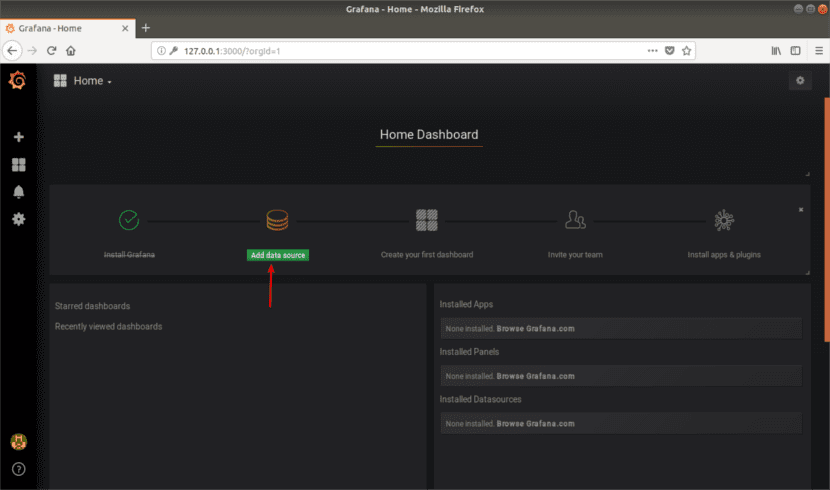
At this point, we will need to add a database or data source. We will click on 'Add data source'. For example, we will add a MySQL database. We will specify the name of the data source, the type and the connection parameters. Then we will click on save and test.

The program will notify us if the connection to the database is successful, as shown in the following screenshot. In case the connection fails, we can consult the documentation on MySQL connections that they offer us on the project website and carry out the necessary configuration.

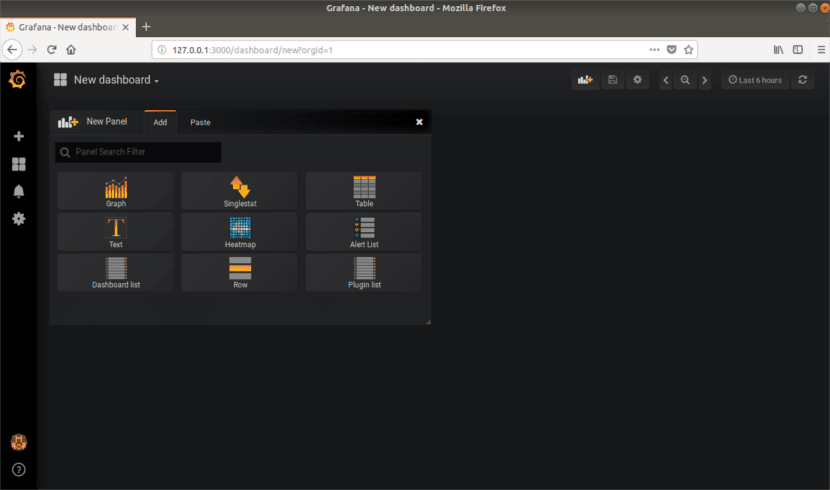
From the Home panel, we will click on New Panel to add a new one. With it we can visualize the metrics of our data source.
From here, we can add more data sources, panels, invite team members, install applications and plugins to extend the default functionalities, etc. For more information you can consult the homepage of the project or directly contact the official documentation.
In short, Grafana is elegant software for the analysis and monitoring real-time data.
»Analysis and monitoring software»
What does it analyze and what does it monitor? I understand from the charts that it analyzes operating system and network load data and monitors the overall health of operating systems. But it could be anything else. Can I analyze and monitor the status of shares on the stock market? Well it could be. After reading the article, no one would say yes or no.
How badly you computer scientists explain yourself!
Basic concepts of Grafana. You can analyze and monitor the data that can be stored in the sources to which Grafana has access. It became clear to me after writing the second paragraph that this was clear. Due to space limitations I could not write all the possibilities of this program. But you can always check the project website where you will find the answers you are looking for.
Yes, the Grafana is very cute and all that. But, like all monitoring systems, more cute or more functional (I personally, Nagios + Cacti since always), what matters is not the amount of graphics per screen, but knowing what you are seeing and how to interpret it according to your operating environment.