Linux stands for web servers, and is that between Apache and Nginx they have a good portion of this market absolutely dominated, and it is known that this is due not only to how powerful both alternatives are but above all to the good options we have for monitor our website with any of them. And it is that this task is extremely important for those who work as system administrators and need to know at all times if the servers are working, and in what way they are doing it.
But alongside well-established and advanced-use solutions like Zenoss or Nagios, we have a good number of simpler tools that we can use to monitor our Linux server more simply, more accessible to downstream users. And now we are going to review a call linux-dash, very complete and simple to install and start using.
Let's see then, how to install linux-dash on Ubuntu and with Nginx as web server (We took this option compared to Apache because it is the one that has grown the most in recent months). To begin with, as always we resort to the command line to enter the following:
sudo apt-get install git nginx php5-json php5-fpm php5-curl
Then we deactivate the default configuration in Nginx:
sudo rm / etc / nginx / sites-enabled / default
Now we need to edit the file /etc/ngingx/conf.d/linuxdash.conf, and we are going to establish that Nginx uses port 8080, so the content of the file should be as follows:
server {
server_name $ domain_name;
listen 8080;
root / var / www;
index index.html index.php;
access_log /var/log/nginx/access.log;
error_log /var/log/nginx/error.log;location ~ * \. (?: xml | ogg |mp3| mp4 | ogv | svg | svgz | eot | otf | woff | ttf | css | js | jpg | jpeg | gif | png | ico) $ {
try_files $ uri = 404;
max expires;
access_log off;
public add_headerPragma;
add_header Cache-Control "public, must-revalidate, proxy-revalidate";
}location / linux-dash {
index index.html index.php;
}# PHP-FPM via sockets
location ~ \ .php (/ | $) {
fastcgi_param SCRIPT_FILENAME $ document_root $ fastcgi_script_name;
fastcgi_split_path_info ^ (. +? \. php) (/.*) $;
fastcgi_pass unix: /var/run/php5-fpm.sock;
if (! -f $ document_root $ fastcgi_script_name) {
404 return;
}
try_files $ uri $ uri / /index.php?$args;
include fastcgi_params;
}
}
Now we have to configure php-fpm, one of the packages that we installed in the first step, which we do by editing the file /etc/php5/fpm/pool.d/www.conf, to add the parameters' user ',' group 'and' listen (the rest of the file can be left unchanged:
user = www-data
group = www-data
listen = /var/run/php5-fpm.sock
We are finally ready to install linux-dash, which does not have PPA but we install from github:
git clone https://github.com/afaqurk/linux-dash.git
sudo cp -r linux-dash / / var / www /
sudo chown -R www-data: www-data / var / www
To finish we only have to restart the Nginx server together with php5-fpm:
sudo service php5-fpm restart
sudo service nginx restart
Now that we have installed this tool, we are going to continue with what follows, which is to see how to use it to effectively monitor our Linux server, and for this we must start the web browser, open a tab and enter the URL of our server followed by port 8080 and the linux-dash installation, which, having followed the steps shown above, should be something like:
http://<linux-IP-address>:8080/linux-dash/
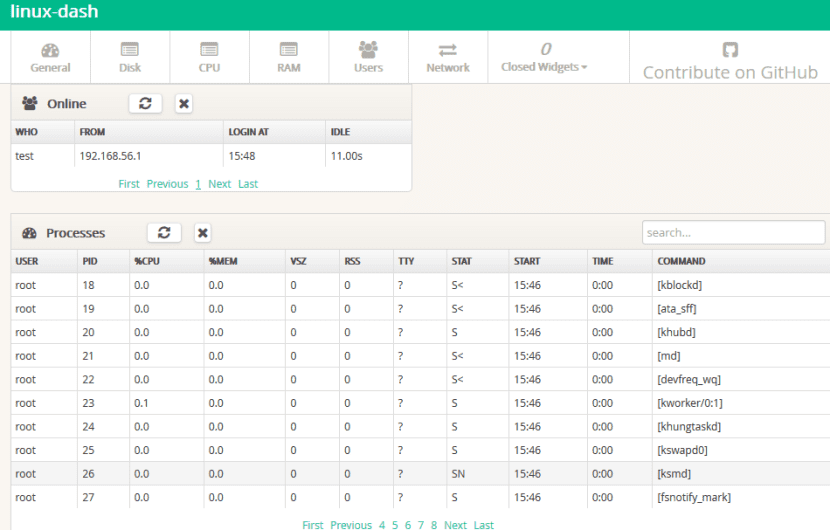
As we see, linux-dash interface is pretty straightforward and it consists of a board in which we can visualize various widgets and in them the system properties, widgets that on the other hand we can rearrange at will to accommodate our preferences as best as possible and we can also use themes to adapt the appearance of linux- dash to our system. Among the different parameters that we will be able to monitor with linux-dash we have the general information of the system (operating system, ram memory, number of cores), the disk use and of each of the mounted partitions of the system, the installed plugins ( mysql, openssl, python, etc), and then all the information related to connectivity: active interfaces (with information about each one of them), the download and upload speed of the server, number of incoming and outgoing connections, ping, connected users and active processes among a few other things.
As we can see, it is a fairly complete solution and best of all, very simple to install and start using, so we do not need to be advanced users to take advantage of it. We hope that these steps have been helpful for our readers to be encouraged to try it, because in more than one case they will find a very pleasant surprise.