
In the next article we are going to take a look at Prometheus. Is about free and open source software that allows us to collect metrics of our applications and store them in a database. It is a monitoring system suitable for dynamic environments. Prometheus is written in Go. It will provide metrics for CPU, memory, disk usage, I / O, network statistics, MySQL server and Nginx.
The collection of metrics carried out is by targets set at specified intervals. It evaluates rule expressions, shows the results and allows to activate alerts if it is observed that any of the defined conditions is true.
Since its inception in 2012, many companies and organizations have chosen to use Prometheus. In addition, the project has a very active community of users and developers. It is a standalone open source project that remains independent from any company. To emphasize this, and to clarify the governance structure of the project, Prometheus joined the Cloud Native Computing Foundation in 2016 as the second hosted project, after Kubernetes.
This program is designed to be used during an interruption, allowing us to quickly diagnose problems with the data it provides us. Each Prometheus server is independent, does not depend on network storage or other remote services. This is why we can rely on it when other parts of our infrastructure fail.
We must clarify that if you need 100% accuracy, such as billing, Prometheus is not a good choice. The data collected is probably not detailed and complete enough. In such a case, it would be better than using some other system to collect and analyze the data for billing.
General Prometheus Features
- It will provide us with a highly dimensional data model. Time series are identified by an indicator name and a set of key-value pairs.
- We will have the possibility to use a flexible query language, which will allow us to cut and cut the collected time series data to generate graphs, tables and ad-hoc alerts.
- We will not have dependency on distributed storage.
- Prometheus has multiple modes to visualize data- An integrated expression explorer, Grafana integration, and a console template language.
- Stores time series in memory and on local disk, in a personalized and efficient format.
- Alerts are defined based on Prometheus' flexible query language and maintain dimensional information. A alert manager handles notifications and muting them.
- All the client libraries allow easy instrumentation of services. Custom libraries are easy to implement.
- Existing exporters allow the creating data bridges with third parties.
For talk to us about this program or its features in more detail, you can consult the project GitHub page.
Install Prometheus

Installing this program on Ubuntu 18.04 is straightforward. We will can install it from software option operating system or we can pull terminal (Ctrl + Alt + T). If we choose this installation option, to begin we update the list of available software. We will continue to install Prometheus by typing the following script:
sudo apt-get update -y && sudo apt-get install prometheus prometheus-node-exporter prometheus-pushgateway prometheus-alertmanager
Once the installation is complete, we can start service that we just installed.
sudo systemctl start prometheus
We can allow that the service starts at the time of starting the equipment typing:
sudo systemctl enable prometheus
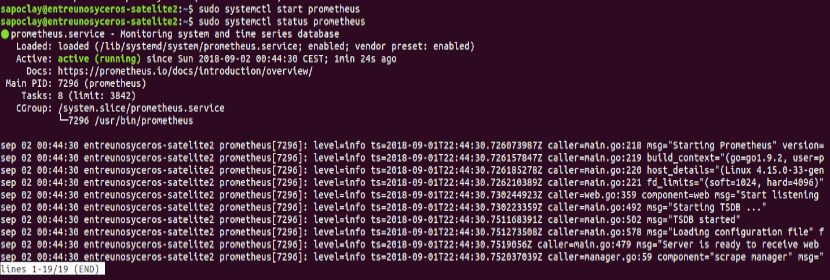
We will be able check service status with the following command:
sudo systemctl status prometheus
Access Prometheus
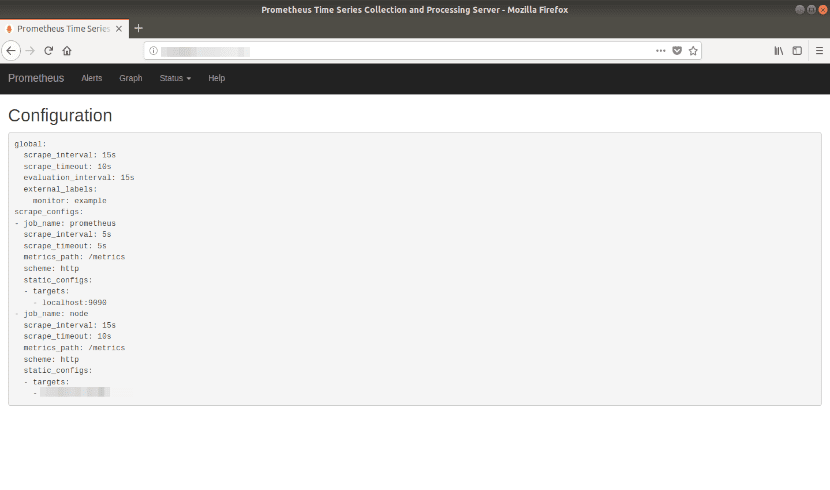
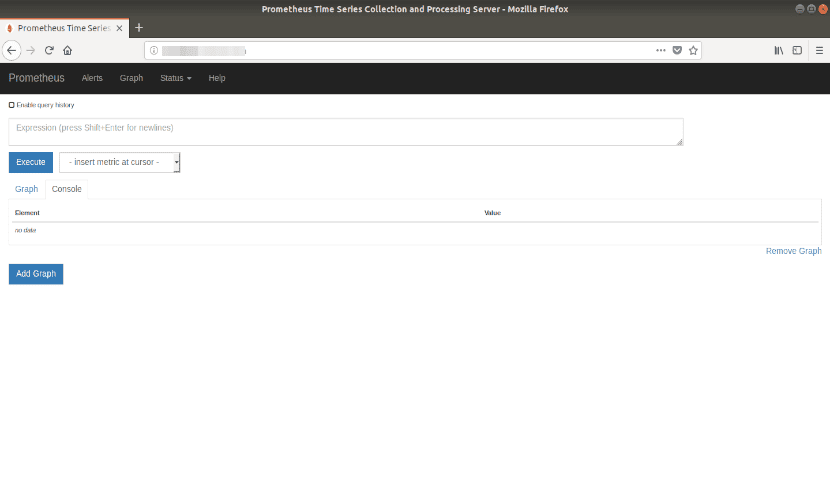
After the installation, we will find that the program listen on port 9090. Now we just have to open our web browser and write the URL http: // your-server-ip: 9090. You will be redirected to the main page from where we can make inquiries.
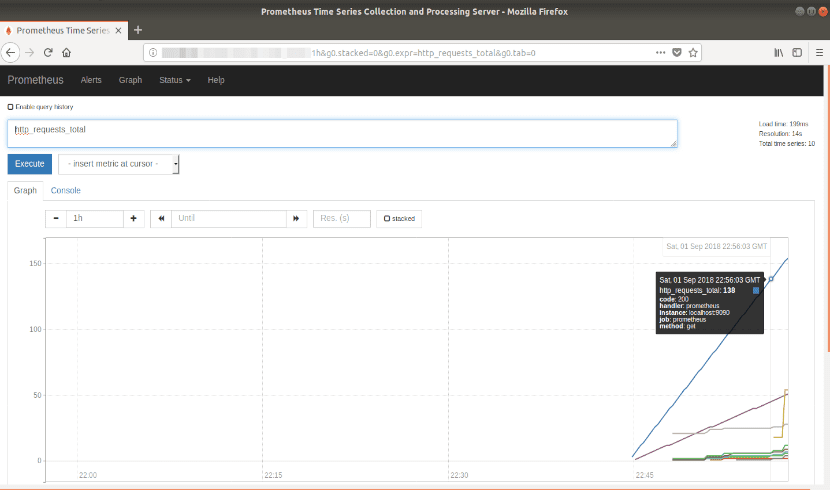
The following would be the result of a data query for this example.
For a better use or to solve any doubts that may arise during the use of this program, we can contact the documentation that we will find on the official page.