
In the next article we are going to take a look at Saidar. For a Gnu / Linux system administrator, it is important monitor system resources to make sure the system is operating in normal and healthy condition, without any unusual activity. Therefore, in the following lines we are going to see a simple tool called Saidar.
Today there are many tools to monitor the resources of a system from the graphical environment or from the command line, with which we can see the statistics of the system in the Gnu / Linux and Unix operating systems. Possibly the most popular and used tool for this purpose is top, although there are also other good alternatives available. With them we will be able to obtain the summary information of the system, as well as a list of processes or threads that the Gnu / Linux kernel currently manages.
Saidar is a fairly simple tool, created to view Gnu / Linux system statistics and resource usage in real time. It is part of the libstatgrab library, which can be used to access key system statistics, including CPU, processes, load, memory, swap, network I / O, disk I / O, and file system information. This tool is written in C and tested on GNU / Linux and various Unix-like distributions such as FreeBSD, NetBSD, OpenBSD, Solaris, DragonFly BSD, HP-UX, and AIX.
When we start Saidar, the tool will will display a screen full of information about system resources, which is updated at regular intervals. In the output we will see statistics on various system resources, including CPU load, memory usage, disk usage, etc.
Install Saidar on Ubuntu
For install Saidar on Ubuntu, Debian, Linux Mint and similar systems, we will only have to open a terminal (Ctrl + Alt + T) and use the following command:
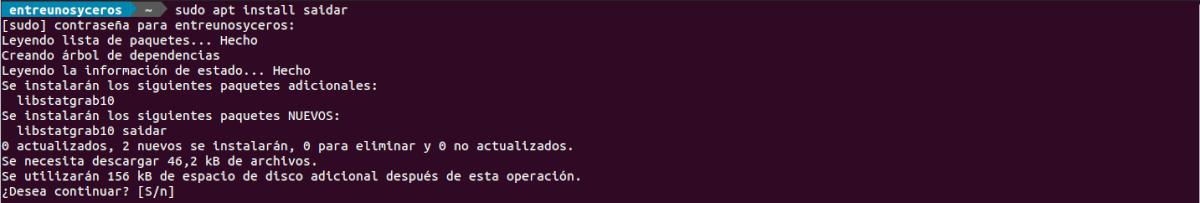
sudo apt install saidar
Using Saidar
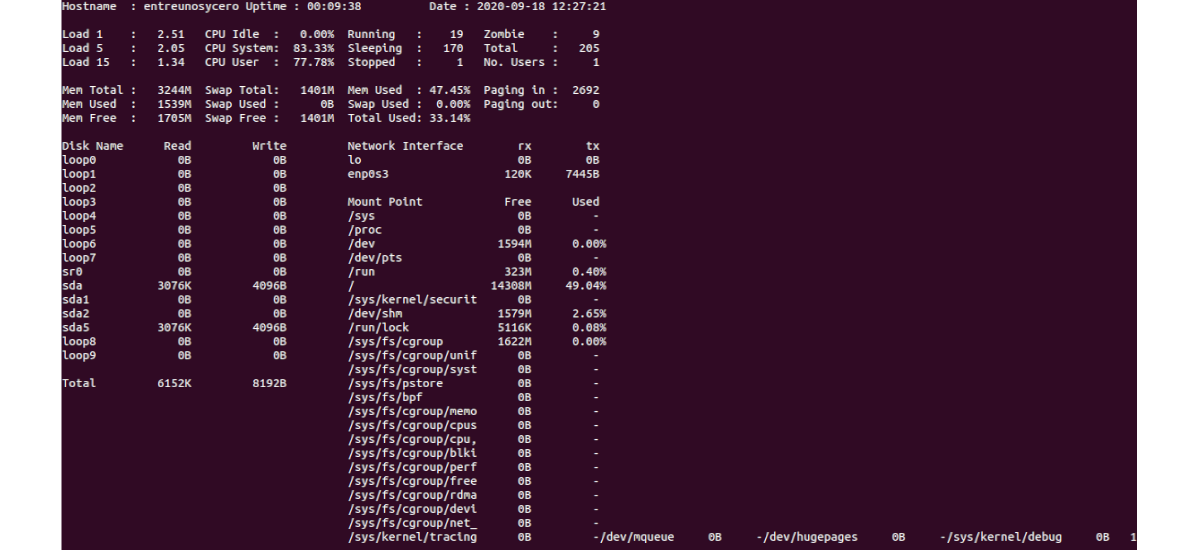
Let start Saidar just typing the name in terminal (Ctrl + Alt + T):
saidar
The update delay is 3 seconds by default, but we will be able to change using the '-d' parameter As follows:
saidar -d 1
The Saidar command displays information including CPU load, memory usage, disk io, disk space usage, network usage.
- As you can see in the screenshot above, the top row shows the following details; System host name, Uptime, Current date and time.
- La second row shows CPU usage statistics like; CPU load, Total number of processes, Total number of processes currently running / sleeping / stopped / zombie, and Total number of registered users.
- La third row displays memory usage details as; Total memory, How much memory is currently being used, How much memory is left, Swap usage (total, used and free) and Paging in / out.
- La fourth row displays details of hard drive, network, and file system like; Disk partitions, Loopback devices, Disk I / O speed, Available network interface cards, Network I / O, System mount points, Total percentage of free and used disk space by each file system.
As with the top command, Saidar will continue to run and monitor system resources until you exit by pressing the q key.
Color output
If we want give it a touch of color, Saidar will be able to generate colored text using the option '-c' As follows:
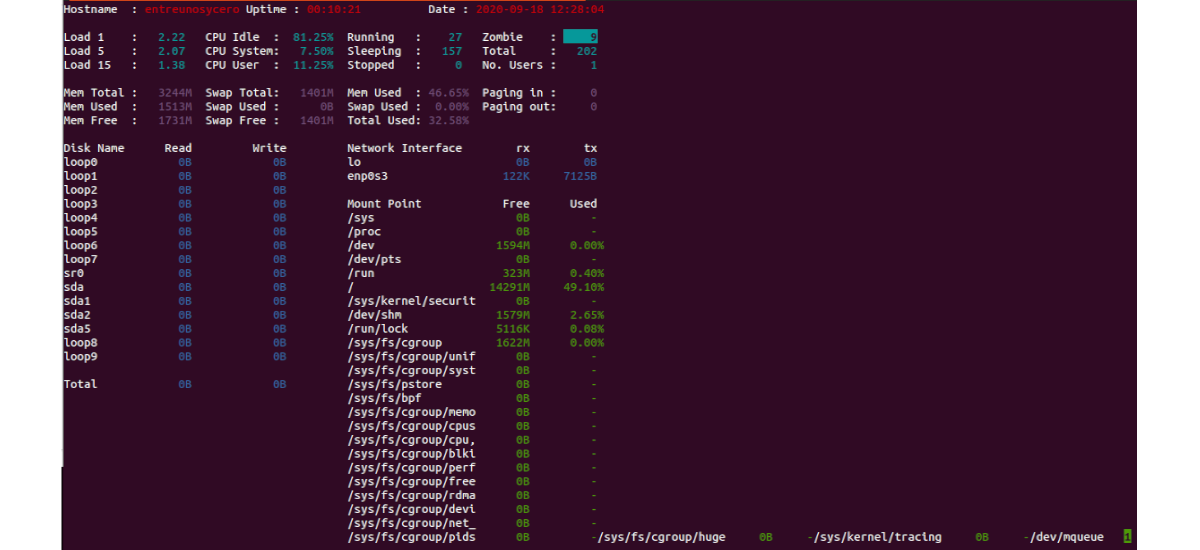
saidar -c -d 1
Help
If need see help for details on supported options, we can use the following command:
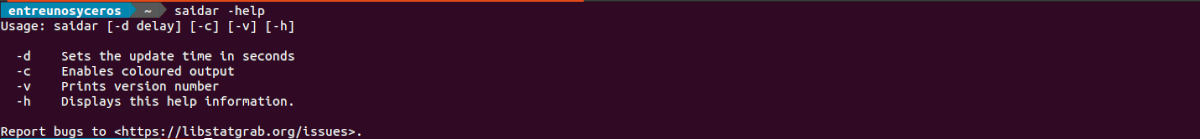
saidar -help
uninstall
For remove this tool from our team, we will only have to open a terminal (Ctrl + Alt + T) and execute the following commands:
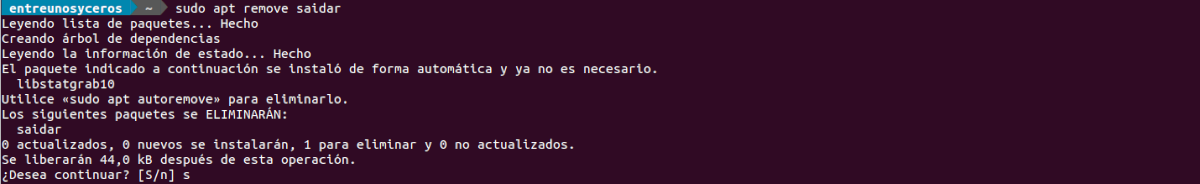
sudo apt remove saidar; sudo apt autoremove
This is just one more option to monitor our system resources. In addition to Saidar, there are many other tools that we will be able to use with the same objective. Some other popular options with which we would obtain the same or similar results would be; htop, Glances, nmon.