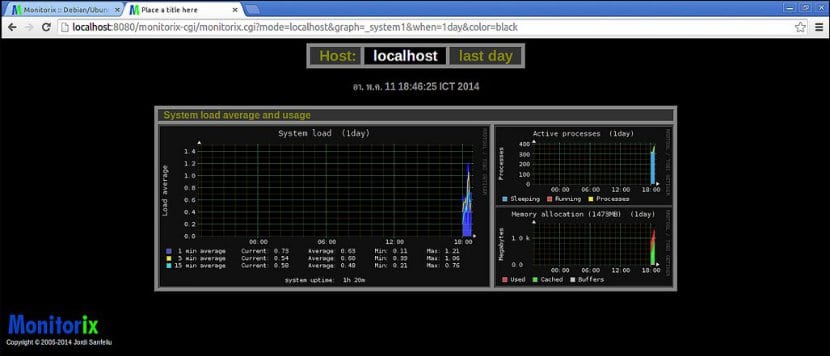
Long ago we saw how to monitor an Nginx server with Linux-dash, but as we all know that we are in this if something is left over in the great free operating system are options, both in relation to the servers and the ways we have to be aware of everything that happens with them. So let's see how to monitor a Linux server with Monitorix, a very advanced and lightweight open source tool.
It is an application that offers its own HTTP server together with a whole series of advanced monitoring functionalities y support for various scripting languages such as Perl, Python, Ruby and others, despite which its resource consumption is so small that it is considered one of the best to be used in devices and embedded systems. In fact, it works through two programs: one called monitorix itself, which is based on Perl and starts automatically, and another called Monitorix.cgi, which as its name suggests is a CGI script.
Some of its features are email statistics, network traffic (incoming and outgoing), of Web server (Apache, Lighttpd, Nginx), MySQL load, use of the Squid proxy or NFS client and server, as well as support for sensors such as those that are compatible with the Raspberry Pi as well as for the most generic ones through the package lmsensors (disk, motherboard, fans, CPU) and of course, active processes, system load and memory use among many other things (we can verify this link all its features).
For install Monitorix on Ubuntu We can do it manually or by installing from repositories. For the first we simply open a terminal window (Ctrl + Alt + T) and execute:
sudo apt-get install rrdtool perl libwww-perl libmailtools-perl libmime-lite-perl librrds-perl libdbi-perl libxml-simple-perl libhttp-server-simple-perl libconfig-general-perl libyan-socket-ssl-perl
Then we download the package for Ubuntu, from the Monitorix download page, and we install it:
sudo dpkg -i monitorix * .deb
During the installation process we will be asked to configure a backend web server, that is, to function as support for this tool. Whether we use the one that includes Monitorix or one like Apache or Nginx, after that configuration we must restart the process, which we do as follows (we simply replace Service name for which it corresponds):
sudo service servicename reload
The other way, more comfortable of course, is to add the Monitorix repositories for Ubuntu, which we do by adding the following line to the /etc/apt/source.list file:
deb http://apt.izzysoft.de/ubuntu generic universe
Then we download the GPG key from the repository and add it:
wget http://apt.izzysoft.de/izzysoft.asc
sudo apt-key add izzysoft.asc
Now we can install Monitorix in the usual way:
sudo apt-get update
sudo apt-get install monitorix
Then we start the service:
sudo service monitorix start
With that we can start, and from now on if we want to configure Monitorix we can do it by editing the file /etc/monitorix/monitorix.conf and then restarting the service for any changes made to take effect.
As we can see, the complete process is quite straightforward and the possibilities it offers us Monitorix as a monitoring tool are very interesting, even more so because it is a project that is under active development and new tools, bug fixes or updates to existing functionality are continually arriving (for example, frequent improvements to graphics and configuration options they offer, as well as the visualization possibilities).
Further information: monitorix (official Web site)